VitalsDeck for macOS
Mac performance, explained like a professional instrument.
VitalsDeck turns menu bar stats into a full Mac health command center: CPU, memory, network, disk, battery, thermals, app impact, AI workloads, session recording, and plain-English diagnostics.

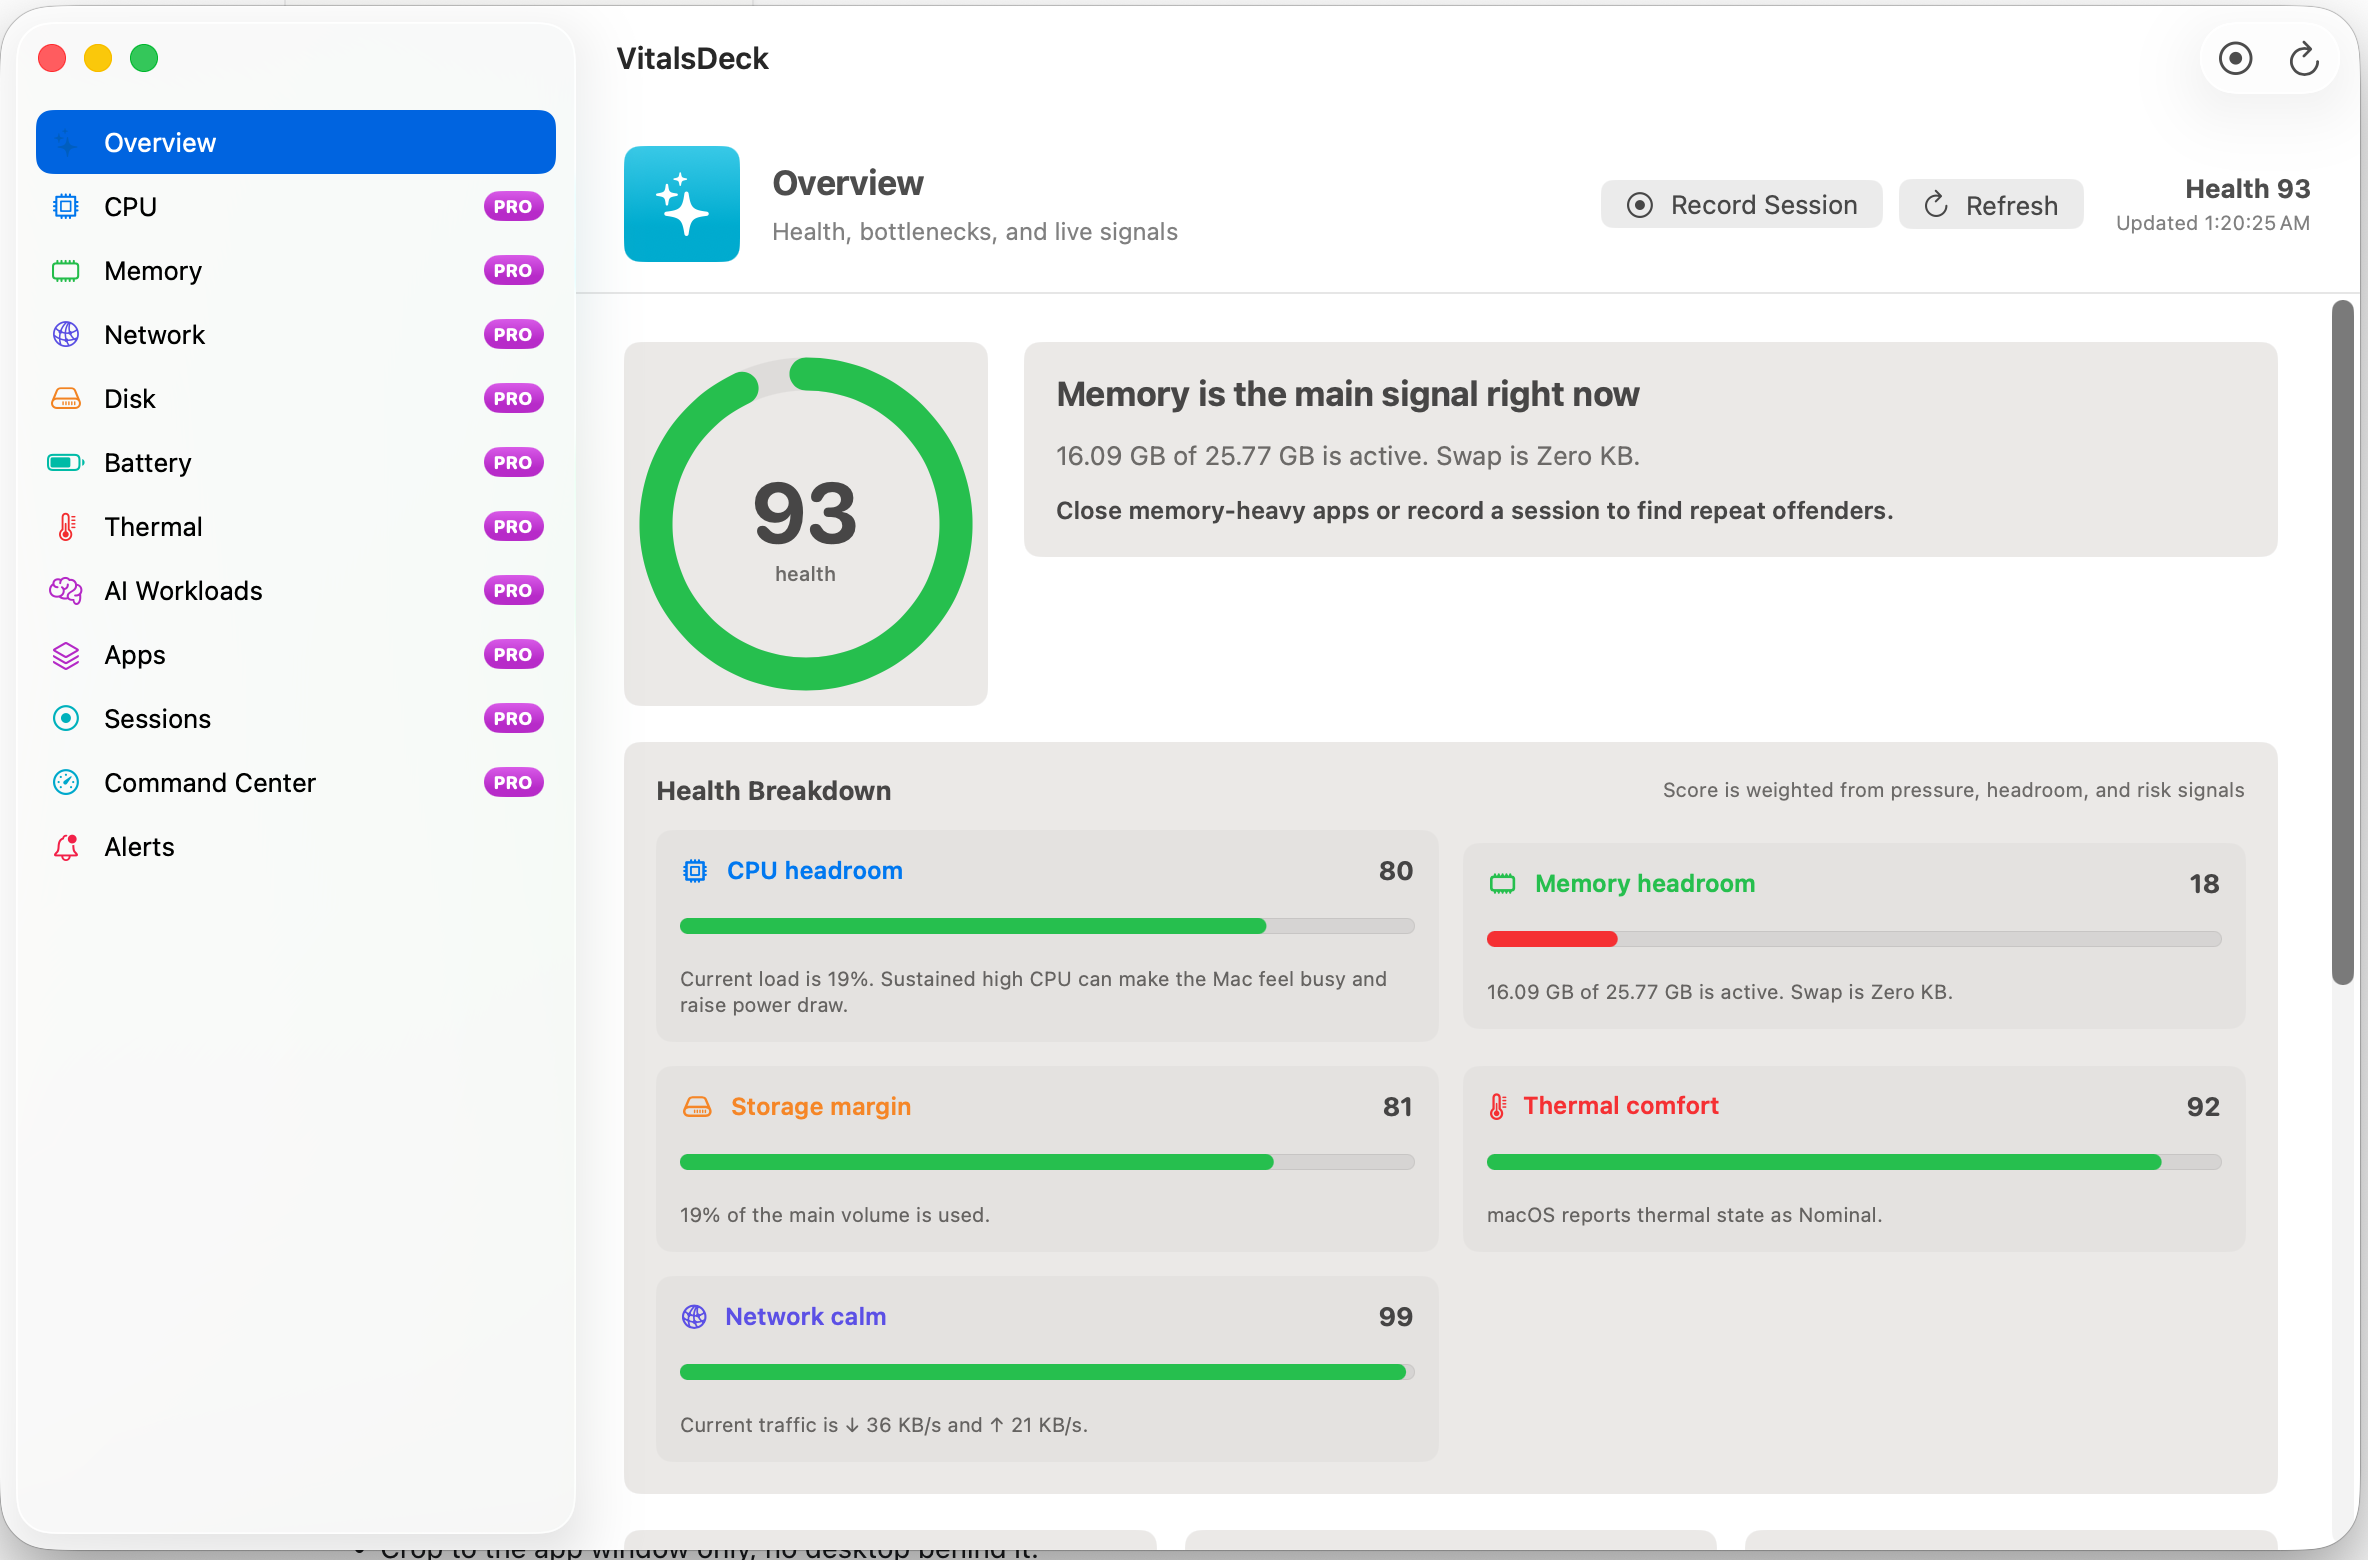
Health score with evidence
Not just “CPU 78%.” A real explanation.
VitalsDeck scores the Mac from multiple signals so the user can see whether the machine is healthy, constrained, overheating, or quietly drifting into a problem.
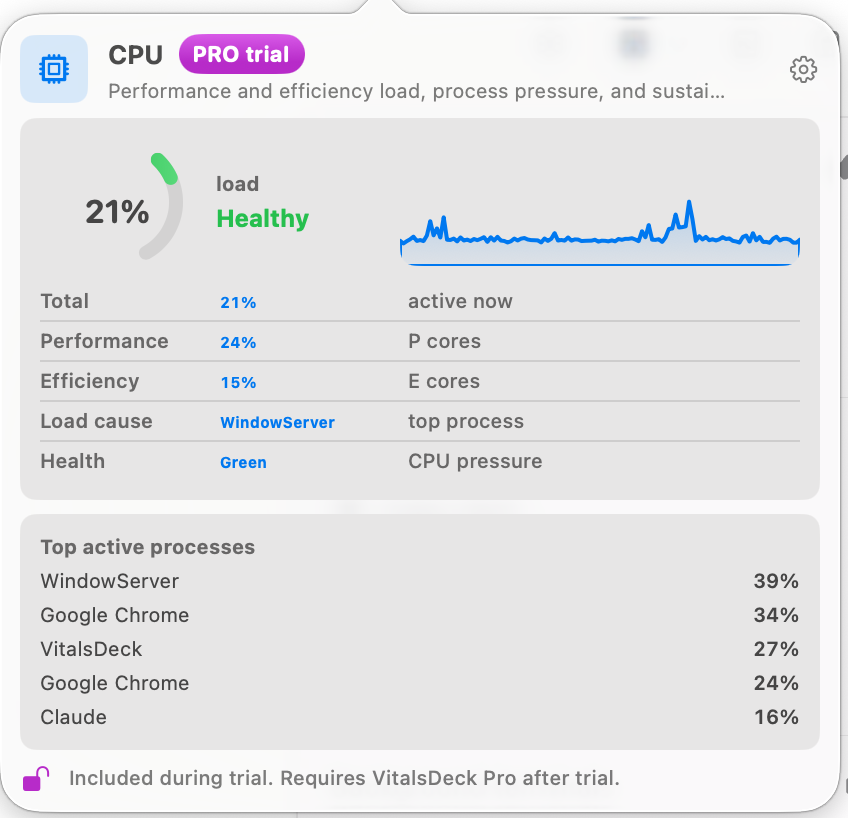
CPU headroom
Tracks active load, sustained pressure, performance versus efficiency core behavior, and top process responsibility.
Memory headroom
Explains pressure, active memory, compression, swap growth, and whether local AI or creative workloads are exceeding comfort.
Thermal comfort
Calls out macOS thermal state so you can see when heat or sustained load may affect responsiveness.
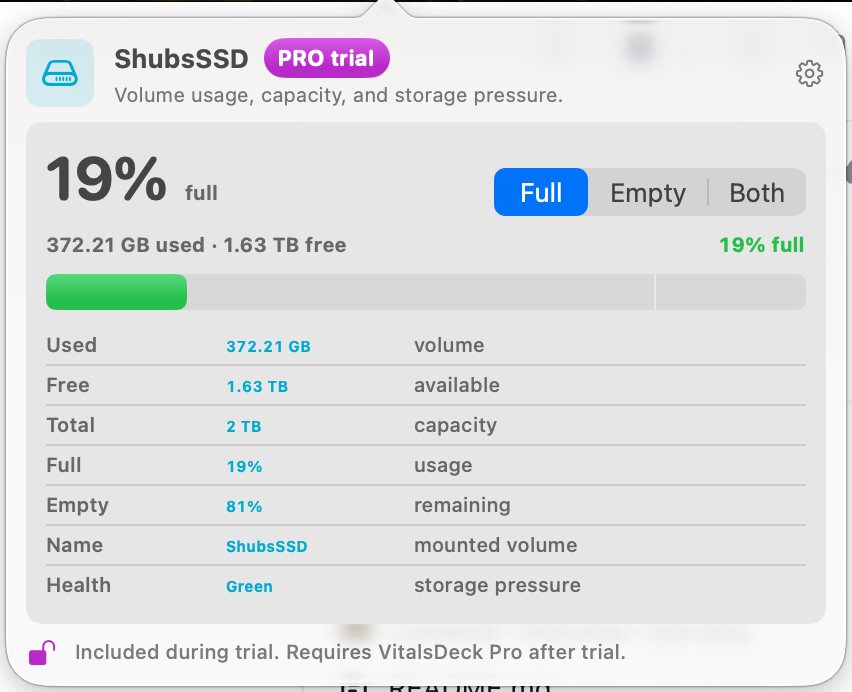
Storage margin
Shows capacity risk, real volume names, used/free space, and why low free space can affect updates, caches, and responsiveness.
Network calm
Highlights upload/download activity, traffic spikes, and connectivity changes for backups, VPNs, calls, and sync tools.
Plain-English insight
Turns the signals into “what is happening, why it matters, and what to do next.”
Professional dashboard
Command Center for the Mac under load.
Command Center is the expanded operational view: live saturation graphs, dense health factors, app impact, memory pressure, thermal state, network rates, disk usage, and the next likely bottleneck.
- IdentifyCPU, memory, disk, network, thermal, or AI bottleneck
- ExplainPlain-English reason and action
- RecordPerformance sessions for builds, renders, games, and local models
- UpgradeUnlock Pro diagnostics directly from the Mac App Store
Live Pro drilldowns
Click a metric. Get the full instrument.
Each menu bar module opens a compact Pro view with real-time charts, health status, pressure, process attribution, and a settings path for that exact signal.
AI workload intelligence
Local LLMs deserve their own signal.
VitalsDeck treats local AI as a first-class workload, separate from ordinary process lists, because Ollama, LM Studio, MLX, llama.cpp, and Python jobs can dominate memory, CPU, and thermals.
Workload detection
Recognizes likely AI processes and separates them from normal app noise.
Model headroom
Recommends 3B, 7B, 14B, or larger model classes based on current memory pressure and free headroom.
Run guidance
Warns when a 14B model may push swap, when 7B is safer, or when the machine has enough space to go bigger.
VitalsDeck Pro
Professional diagnostics for the Mac App Store build.
The core app stays useful, while a one-time Pro unlock adds the deeper visibility that power users, developers, creators, and local-AI users need from the Mac App Store build.
Advanced modules
CPU, memory, network, disk, battery, thermal, apps, sessions, AI workloads, and Command Center provide deeper Pro diagnostics.
Compact drilldowns
Click menu bar metrics to open dense graphical views with health, pressure, process context, and live trends.
Pro workflows
Session recording, exportable diagnostics, pattern alerts, AI workload recommendations, and app impact grouping.
Learn
Practical Mac performance guides.
Short, searchable guides for the exact problems VitalsDeck helps diagnose.
Best Mac system monitor
What to look for in a useful menu bar monitor and why raw numbers are not enough.
Why is my Mac slow?
A simple diagnostic path for CPU, memory, disk, network, thermal, and app bottlenecks.
Monitor local AI workloads
How to watch Ollama, LM Studio, MLX, llama.cpp, and Python jobs without guessing.