What most Mac monitors miss
Many menu bar monitors are excellent at showing numbers, but numbers without context create a second job: interpreting what they mean. CPU at 78% may be fine during a compile and suspicious when the Mac is idle. Memory at 70% may be harmless if pressure is low, or urgent if swap is growing. Disk usage at 90% may explain update failures, cache problems, or slowdowns.
The better question is not “what is the number?” It is “what is the limiting factor right now?”
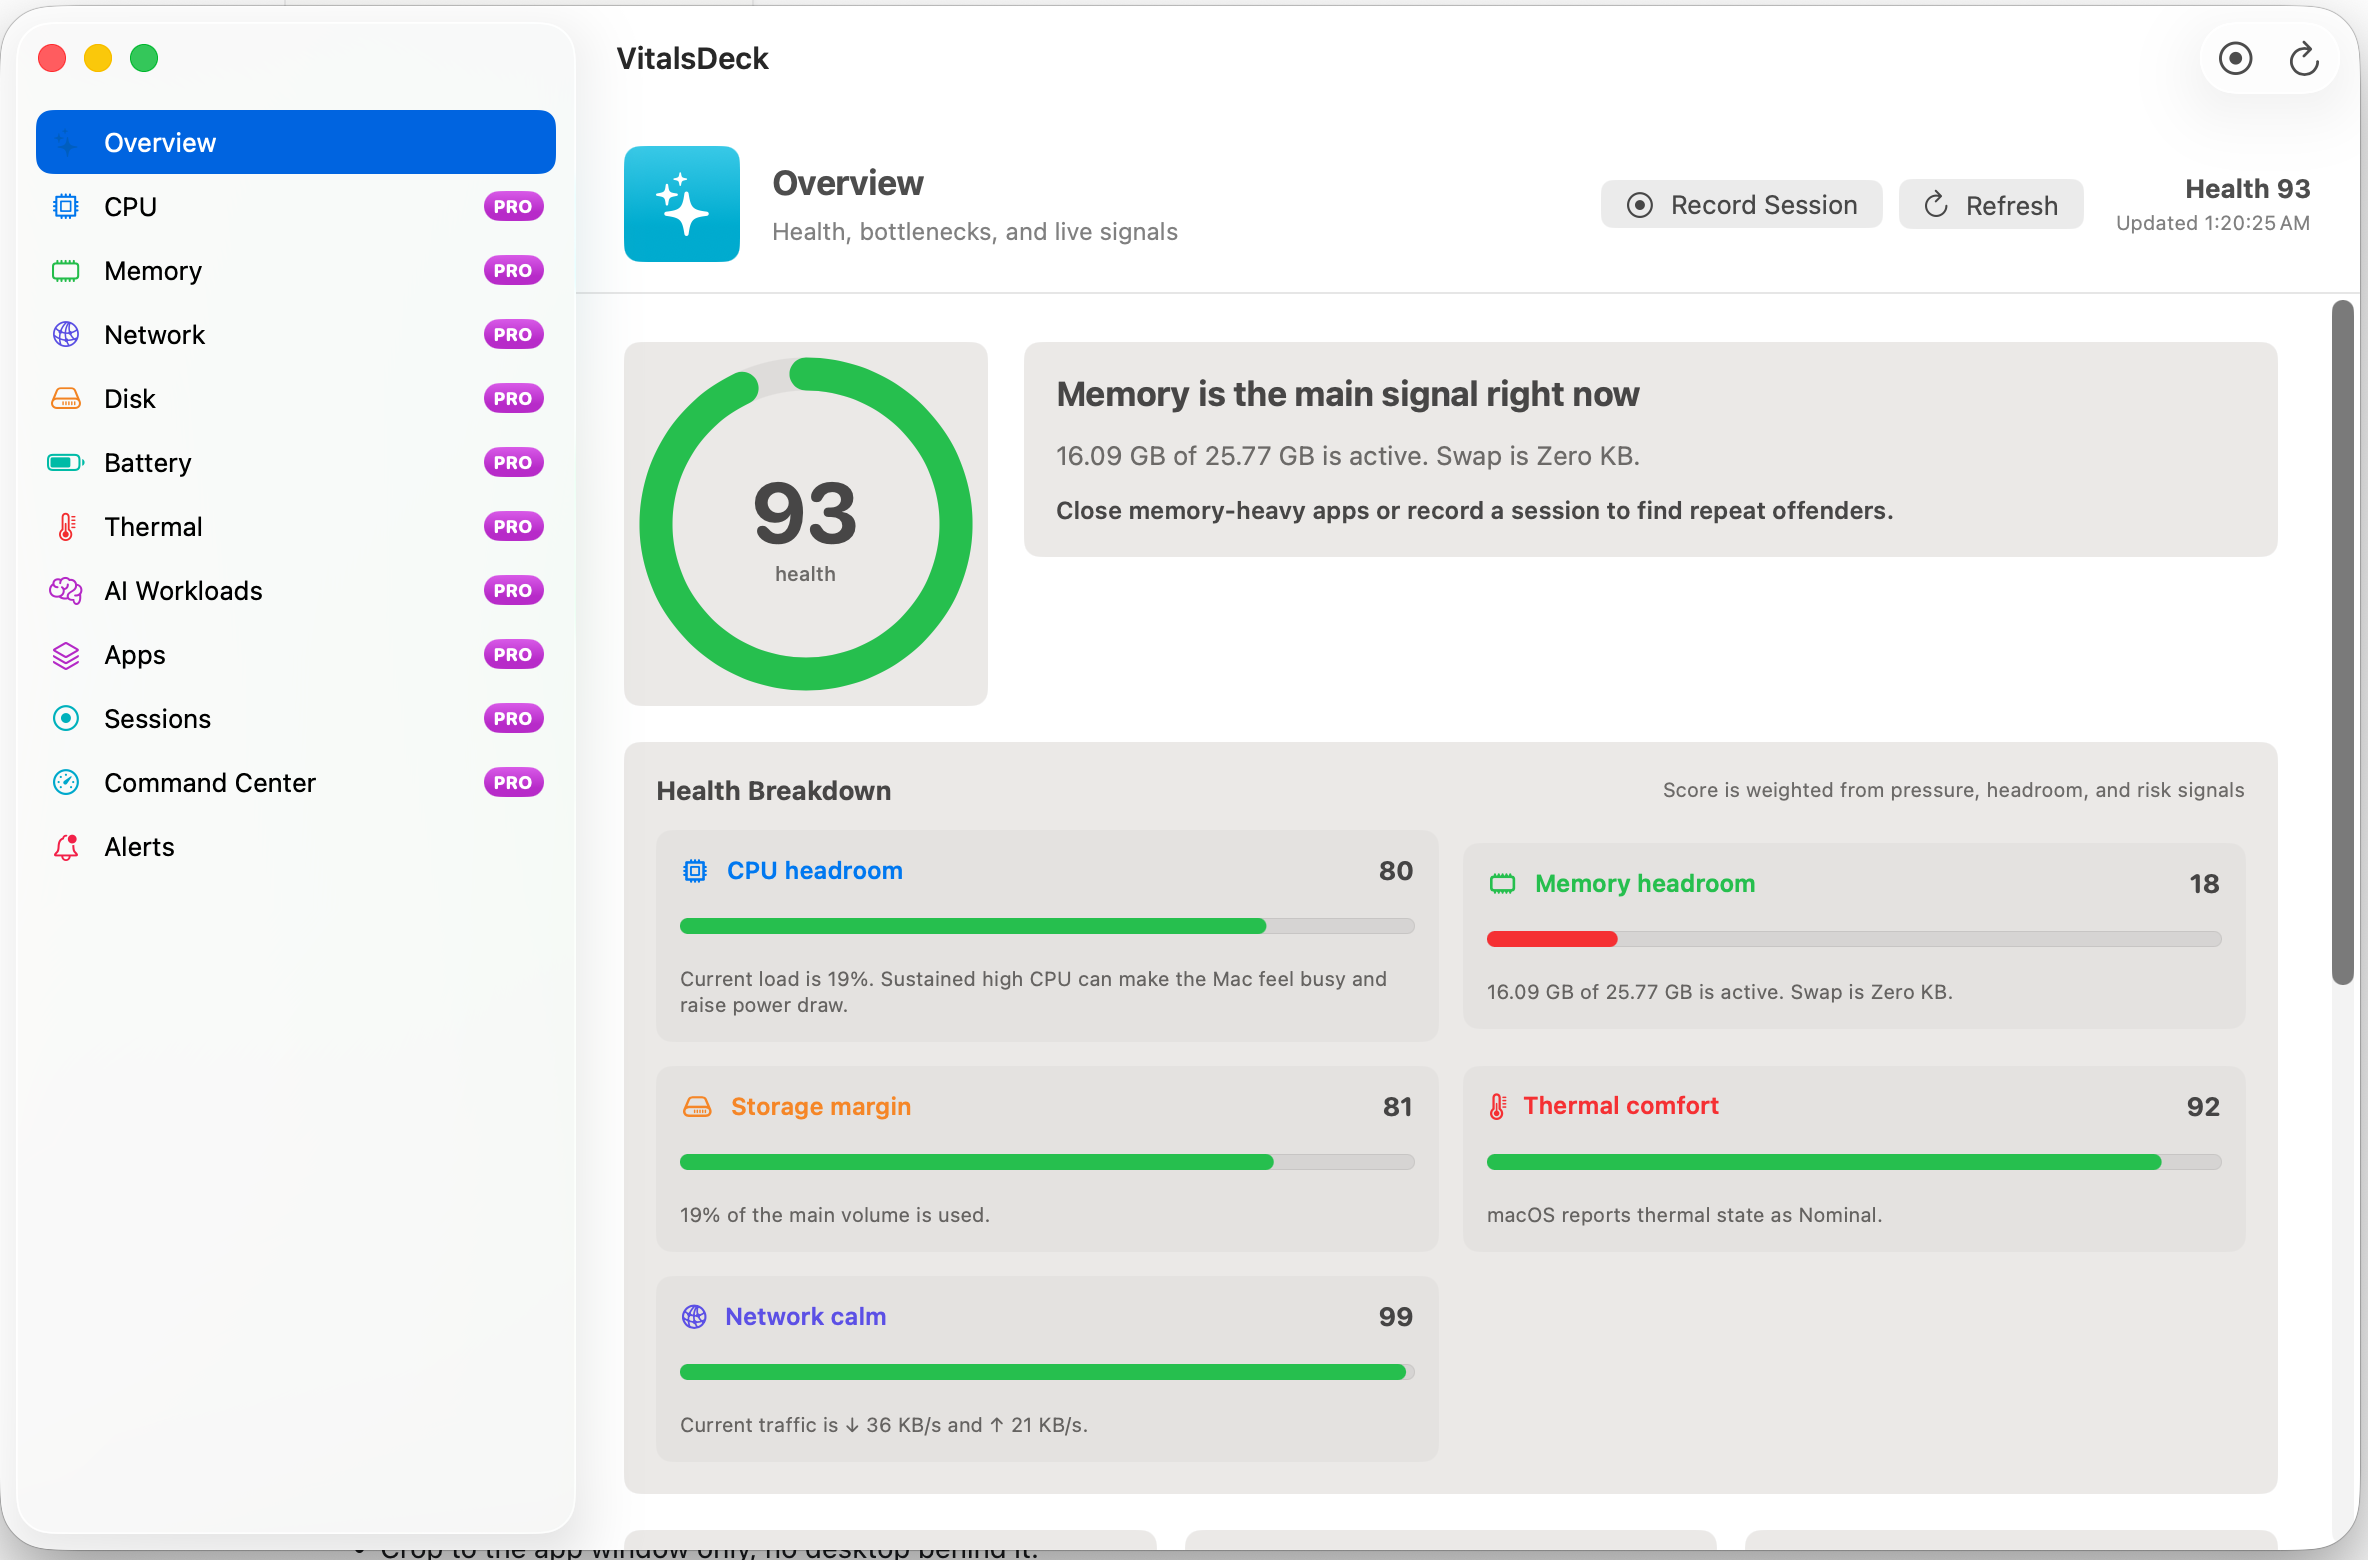
CPU headroom
Look for current load, sustained pressure, top process, and whether performance cores are active.
Memory pressure
Watch active memory, swap, compression, and available headroom instead of only used percentage.
Storage margin
Track both used and free space by real volume name so disk pressure is clear.
Thermal comfort
Heat can quietly reduce responsiveness, especially during builds, games, renders, or local AI.
Network activity
Upload and download spikes can explain lag during cloud sync, VPN use, backups, or calls.
App impact
Useful monitoring should point to the process or app family causing the pressure.
Why VitalsDeck is different
VitalsDeck combines compact menu bar signals with graphical drilldowns and a health-centered dashboard. It is built for people who want the speed of menu bar stats, but the explanation of a diagnostic tool.
- Menu bar modules for CPU, GPU, RAM, disk, sensor state, and upload/download activity.
- Detailed views for CPU, memory, disk, network, battery, thermals, apps, sessions, AI workloads, and alerts.
- Plain-English insight that tells you what is happening and what to inspect next.
- Local AI workload awareness for Ollama, LM Studio, MLX, llama.cpp, and Python-based jobs.